import pandas as pd

df = pd.read_csv("data/ml-ready/cdi-customer-churn.csv")

X = df.drop(columns="churn")
y = df["churn"]Feature Importance and Interpretation
Interpretation Is Not the Same as Prediction
A model can predict well and still be poorly understood.
Interpretation asks different questions:
- Which features does the model rely on?
- How sensitive are predictions to each feature?
- Are relationships stable or dataset-specific?
Interpretation is useful, but it requires caution.
Feature importance is not causality.
Global vs Local Explanations
Accuracy asks: how often are we right?
Interpretability asks: why are we right (or wrong)?
There are two common levels of explanation:
- Global: what inputs matter most overall in the model
- Local: why a specific record received a specific prediction
This lesson focuses on global feature influence using feature importance.
We include a lightweight local check to make interpretation feel concrete, without introducing heavy tooling.
Load Data
Train/Test Split
from sklearn.model_selection import train_test_split

X_train, X_test, y_train, y_test = train_test_split(
    X,
    y,
    test_size=0.2,
    random_state=42,
    stratify=y
)
Define Preprocessing
from sklearn.compose import ColumnTransformer
from sklearn.preprocessing import OneHotEncoder, StandardScaler
from sklearn.pipeline import Pipeline

numeric_features = X.select_dtypes(include=["int64", "float64"]).columns
categorical_features = X.select_dtypes(include=["object"]).columns

numeric_transformer = Pipeline(
    steps=[("scaler", StandardScaler())]
)

categorical_transformer = Pipeline(
    steps=[("encoder", OneHotEncoder(handle_unknown="ignore"))]
)

preprocessor = ColumnTransformer(
    transformers=[
        ("num", numeric_transformer, numeric_features),
        ("cat", categorical_transformer, categorical_features)
    ]
)
Train a Model
For feature importance, tree-based models are convenient because they provide built-in importances.
from sklearn.tree import DecisionTreeClassifier

tree = Pipeline(
    steps=[
        ("preprocessor", preprocessor),
        ("classifier", DecisionTreeClassifier(
            max_depth=4,
            min_samples_leaf=10,
            random_state=42
        ))
    ]
)

tree.fit(X_train, y_train)
Pipeline(steps=[('preprocessor',
ColumnTransformer(transformers=[('num',
Pipeline(steps=[('scaler',
StandardScaler())]),
Index(['tenure_months', 'monthly_spend', 'support_calls'], dtype='str')),
('cat',
Pipeline(steps=[('encoder',
OneHotEncoder(handle_unknown='ignore'))]),
Index(['customer_id', 'contract_type', 'autopay'], dtype='str'))])),
('classifier',
DecisionTreeClassifier(max_depth=4, min_samples_leaf=10,
random_state=42))])In a Jupyter environment, please rerun this cell to show the HTML representation or trust the notebook. On GitHub, the HTML representation is unable to render, please try loading this page with nbviewer.org.
Parameters
Parameters
Index(['tenure_months', 'monthly_spend', 'support_calls'], dtype='str')
Parameters
Index(['customer_id', 'contract_type', 'autopay'], dtype='str')
Parameters
Parameters
Built-in Feature Importance (Expanded Features)
Decision trees provide a feature importance score.
Because one-hot encoding expands categorical variables into multiple columns, we build the expanded feature names first.
import numpy as np

ohe = (
    tree.named_steps["preprocessor"]
        .named_transformers_["cat"]
        .named_steps["encoder"]
)

cat_names = ohe.get_feature_names_out(categorical_features)
expanded_feature_names = np.concatenate([numeric_features, cat_names])

len(expanded_feature_names)648Extract importance values from the fitted tree.
importances = tree.named_steps["classifier"].feature_importances_

imp_df = pd.DataFrame({
    "feature": expanded_feature_names,
    "importance": importances
}).sort_values("importance", ascending=False)

imp_df.head(10)| feature | importance | |
|---|---|---|
| 1 | monthly_spend | 0.609083 |
| 0 | tenure_months | 0.201316 |
| 643 | contract_type_month-to-month | 0.136050 |
| 2 | support_calls | 0.053552 |
| 435 | customer_id_C100544 | 0.000000 |
| 427 | customer_id_C100534 | 0.000000 |
| 428 | customer_id_C100535 | 0.000000 |
| 429 | customer_id_C100536 | 0.000000 |
| 430 | customer_id_C100538 | 0.000000 |
| 431 | customer_id_C100539 | 0.000000 |
Plot top features.
import matplotlib.pyplot as plt

top = imp_df.head(10).iloc[::-1]

fig, ax = plt.subplots()
ax.barh(top["feature"], top["importance"])
ax.set_xlabel("Importance")
ax.set_title("Top Feature Importances (Decision Tree)")
plt.show()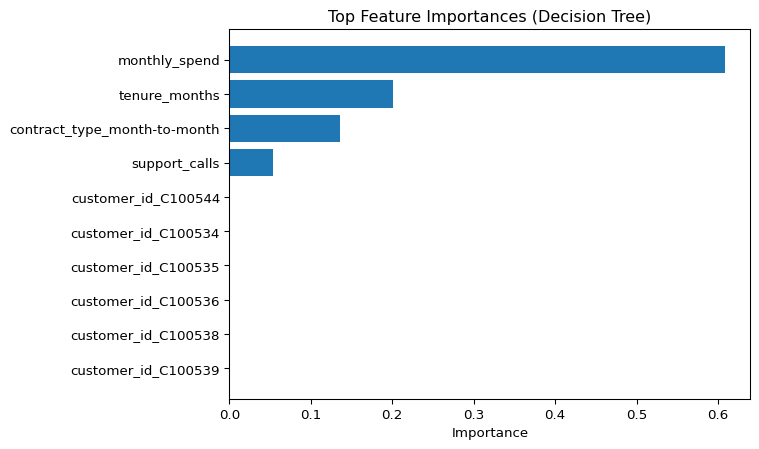
Permutation Importance (Original Features)
Permutation importance measures how much model performance drops when one input feature is randomly shuffled.
When computed on a pipeline, the permutation happens on the original input columns.
That means the results align with:
X.columns
not with expanded one-hot feature names.
from sklearn.inspection import permutation_importance

result = permutation_importance(
    tree,
    X_test,
    y_test,
    n_repeats=10,
    random_state=42,
    scoring="f1"
)

perm_df = pd.DataFrame({
    "feature": X.columns,
    "importance_mean": result.importances_mean,
    "importance_std": result.importances_std
}).sort_values("importance_mean", ascending=False)

perm_df.head(10)| feature | importance_mean | importance_std | |
|---|---|---|---|
| 2 | monthly_spend | 0.051062 | 0.018469 |
| 3 | support_calls | 0.020419 | 0.014855 |
| 4 | contract_type | 0.014887 | 0.007450 |
| 1 | tenure_months | 0.009057 | 0.011963 |
| 0 | customer_id | 0.000000 | 0.000000 |
| 5 | autopay | 0.000000 | 0.000000 |
Plot permutation importances.
top_p = perm_df.head(10).iloc[::-1]

fig, ax = plt.subplots()
ax.barh(top_p["feature"], top_p["importance_mean"])
ax.set_xlabel("Mean importance (F1 drop)")
ax.set_title("Top Permutation Importances (Original Features)")
plt.show()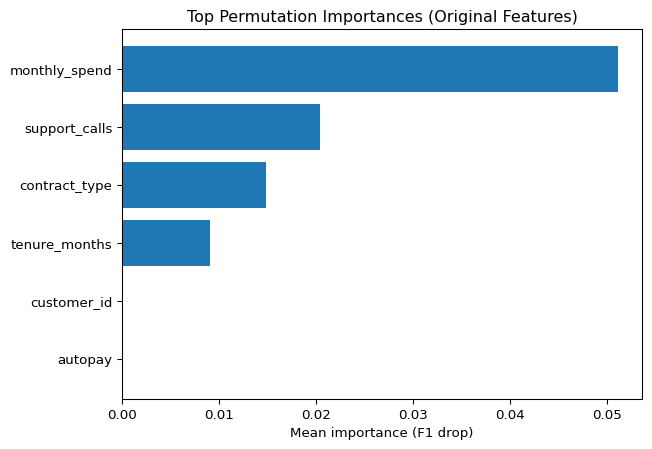
A Lightweight Local Check
A true local explanation requires dedicated methods.
Here we do a lightweight check:
- take one record
- compute its predicted probability
- inspect the input values
row = X_test.iloc[[0]]
proba = tree.predict_proba(row)[0, 1]

probanp.float64(0.14285714285714285)row.T| 277 | |
|---|---|
| customer_id | C100277 |
| tenure_months | 47 |
| monthly_spend | 22.29 |
| support_calls | 1 |
| contract_type | month-to-month |
| autopay | yes |
This is not a full explanation, but it helps connect model output to a real input record.
Interpreting Importances Responsibly
Important does not mean causal.
A feature can appear important because:
- it is correlated with the true driver
- it encodes historical behavior
- it captures an operational artifact
- it is specific to this dataset
Use feature importance as a diagnostic tool.
Not as a causal claim.
Looking Ahead
In the next lesson, we close the free track.
We summarize what you can now do confidently, and what requires deeper study.